Reporting
Create powerful reports
Save time analysing data - build real-time reports that are quick to set up and automatically update with project changes. Build dashboards to display key information and create Quick Chart reports for detailed in-depth analysis. Drill down through reports by filtering data by location, product, users, store format or any other element in your project.
For additional reporting capabilities, integrate TeamHaven into third party reporting tools such as ZOHO Analytics and Microsoft Power BI. You can also extract data from TeamHaven into Excel and ZIP files.

See activity from the field
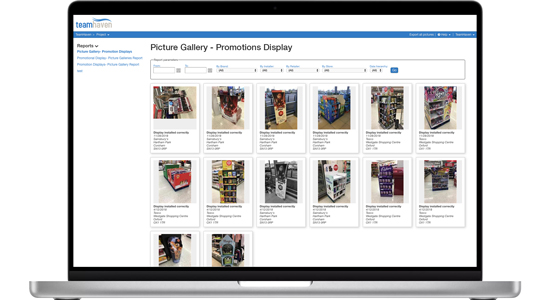
See photos from the field in one place with tailored picture gallery reports that update in real-time. Share picture galleries with key stakeholders and select the images you would like them to see.
For an in-depth insight into your activities, filter photos by location, store type, display or any other element in your projects. Keep a historical record of your photos by downloading images into a pre-sorted ZIP folder.
Monitor field teams
Check field teams’ efficiency using a range of productivity reports. Use online reports to see field staff start date, activity duration as well as other factors. Get automatic email notifications when field staff have not turned up for work, are late, or do not meet project requirements.
Check and negotiate travel expenses using TeamHaven’s Time and Distance report and use a Payroll report to calculate the amount you need to pay each member of staff using their individual pay rates.

Manage data in one place
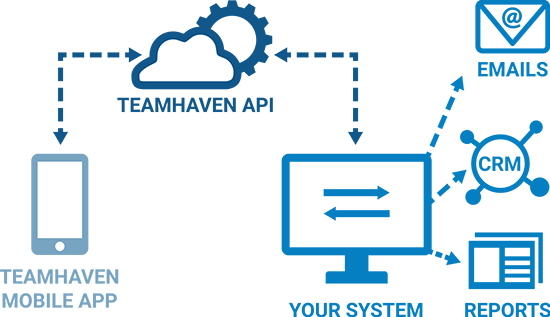
Have a complete overview and analysis of projects by integrating TeamHaven with your own systems or BI reporting tools.
As well as creating reports using the information collected in TeamHaven, you can integrate important data from your own systems, such as stock and sales.
Ranging from the free TeamHaven Web API to the TeamHaven Server App or the TeamHaven Sync Tool, choose from a range of options to best suit your needs and budget.


